
Powerful Data Analysis with Power BI and Office 365
I am finally thawed out from reIMAGINE 2014 in Fargo. What an amazing learning experience! Microsoft is dedicated to expanding application enhancements to facilitate a seamless user experience across platforms. From Dynamics GP to CRM and Office 365, Microsoft is continuing to optimize the user interface and help people create impactful analytics presentations. Here’s what I learned about Power BI.
Your company’s data lives in many different places. How can you turn all of your information into strategic insight to power your business? The answer: Power BI. Microsoft delivers with this effective tool to help you discover, analyze, visualize, and collaborate – enabling smarter decision making and dynamic interaction across your business.
Self-service BI available in Excel 2013 allows you to present your data in insightful and interesting ways. Answer your questions quickly and easily in the Excel format you already know.
- Power Query– easily discover and connect to data from public and corporate data sources. Optimize social insights, financial analysis, and operational procedures with targeted searches and performance visibility.
- Power Pivot – create a sophisticated Data Model directly in Excel with refreshable live data. Also great for sharing dashboard data offline.
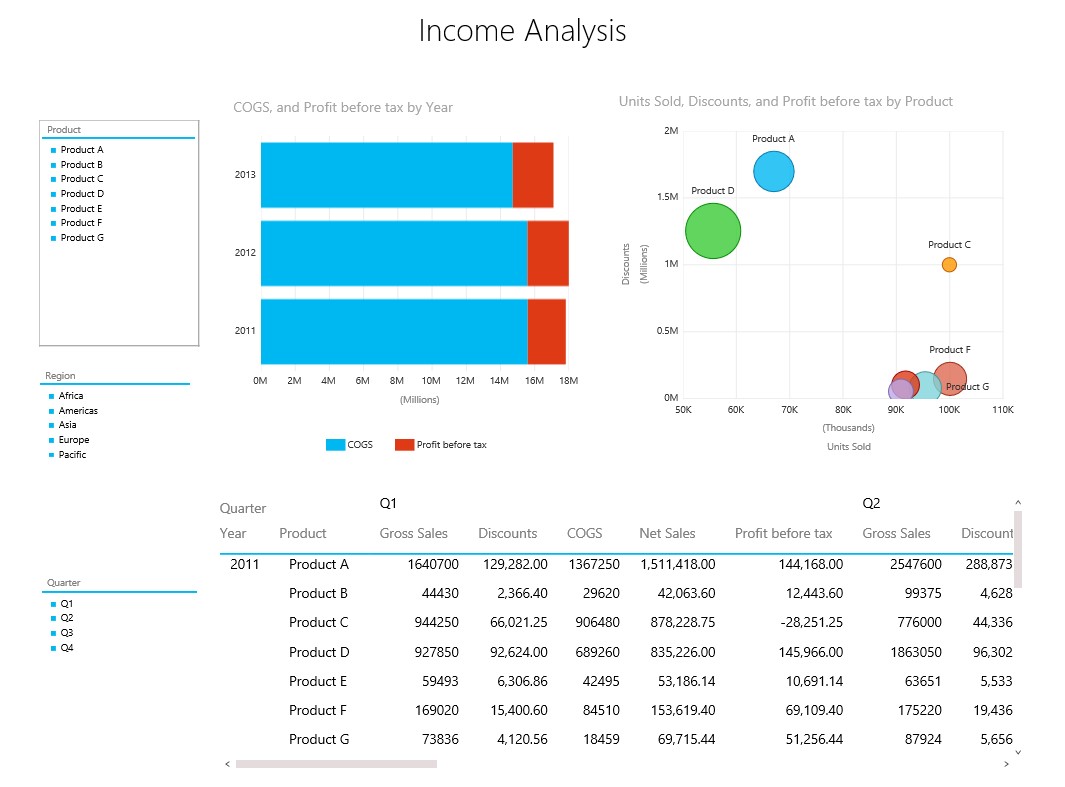
- Power View– create reports and analytical views with interactive data visualizations and geo mapping. Power View is easy for non-technical users to operate in the Power BI App.
- Power Map– explore and navigate geospatial data on a 3D map experience in Excel with impactful visualization and easily shareable videos.

The Power BI App for Office 365 allows you to magnify these capabilities through a collaborative online environment. Employees can access reports and connect with important information with robust querying and data views.
- Power BI Sites – share, view, and interact with reports in these collaborative Power BI sites that can be accessed anywhere, even on tablets.
- Power BI Q&A – use natural language queries to find, explore, and report over your data. Even users that do not understand SQL can create queries to find the information they need.
- Query and Data Management – share and manage queries and data sources, and view query usage analytics.
- Power BI Windows Store App– view reports on the go, with the Power BI app. The app is great for users that need remote access.
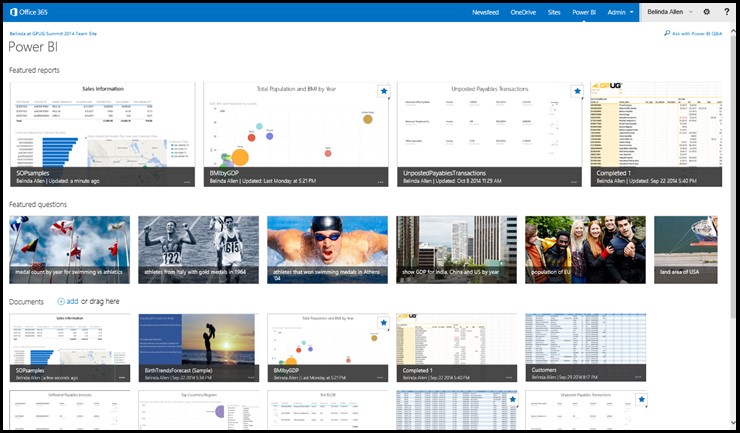
See all of the information you need to be more productive in one place with the Power BI app.
Be smart. Be agile. Be empowered with Power BI from Microsoft. Conexus SG can show you how to change the way you think about data.